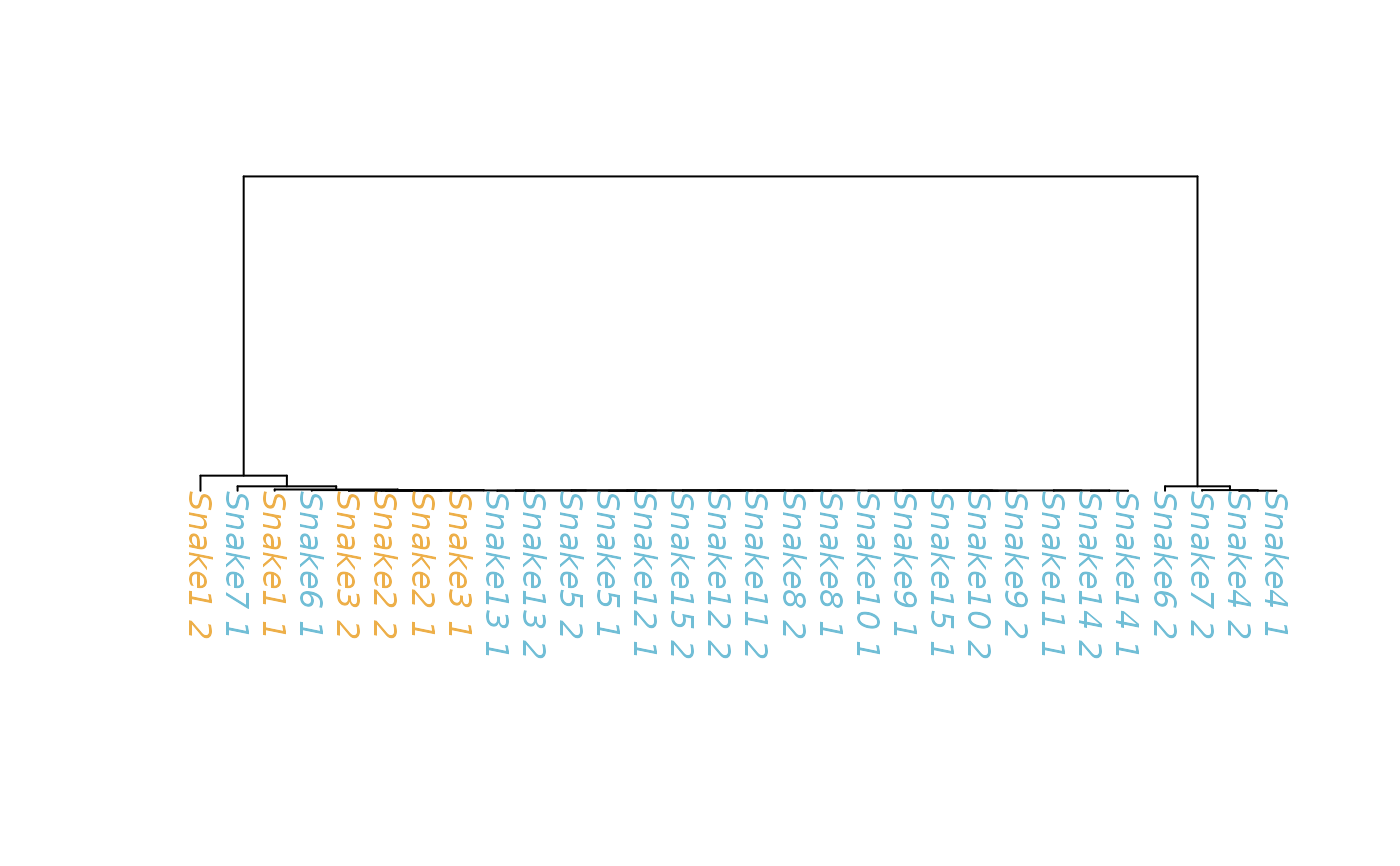
Visualize ancestral recombination graphs.
Usage
argplot(
  arg,
  pop1,
  pop2,
  col = c("#6C6EA0", "#1A1F16"),
  scale = NULL,
  font.size = 1
)
Arguments
- arg
a newick string of ancestral recombination graph to be visualized.
- pop1
a vector of individuals in population one.
- pop2
a vector of individuals in population two.
- col
a vector of two colors. The first color will be used to color the tips of population 1 and the second will color population 2 tips.
- scale
a vector of two numbers. The first number will set the lower bounds of the scale and the second will set the upper bounds. This is useful when you want to compare two args.
- font.size
a numeric indicating the size of the tip labels, this is supplied to the cex argument in phytools plotTree function.
Examples
# \donttest{

data(rattlesnake_args)
data(rattlesnake_pops)

pop2 <- rattlesnake_pops[which(rattlesnake_pops$species == "pop2"),]
pop1 <- rattlesnake_pops[which(rattlesnake_pops$species == "pop1"),]

test_plot <- argplot(arg = rattlesnake_args[[1]][1,4], pop1 = pop1$sample, pop2 = pop2$sample, col = c("#71BED6","#EDAF49"))# }