Welcome
Welcome to the PopGenHelpR vignette, please contact the authors if you have any questions about the package. You can also visit our Github for additional examples (https://kfarleigh.github.io/PopGenHelpR/).
# Load the package
library(PopGenHelpR)
Overview of PopGenHelpR
PopGenHelpR is a one-stop package for data analysis and
visualization. PopGenHelpR can calculate commonly used
population genomic statistics such as heterozygosity and genetic
differentiation, with the functions Heterozygosity,
Differentiation, and Private.alleles. While
also producing publication-quality figures using the functions
Ancestry_barchart, Network_map,
Pairwise_heatmap, and Piechart_map. Check out
the vignette below to see all of these functions in action!
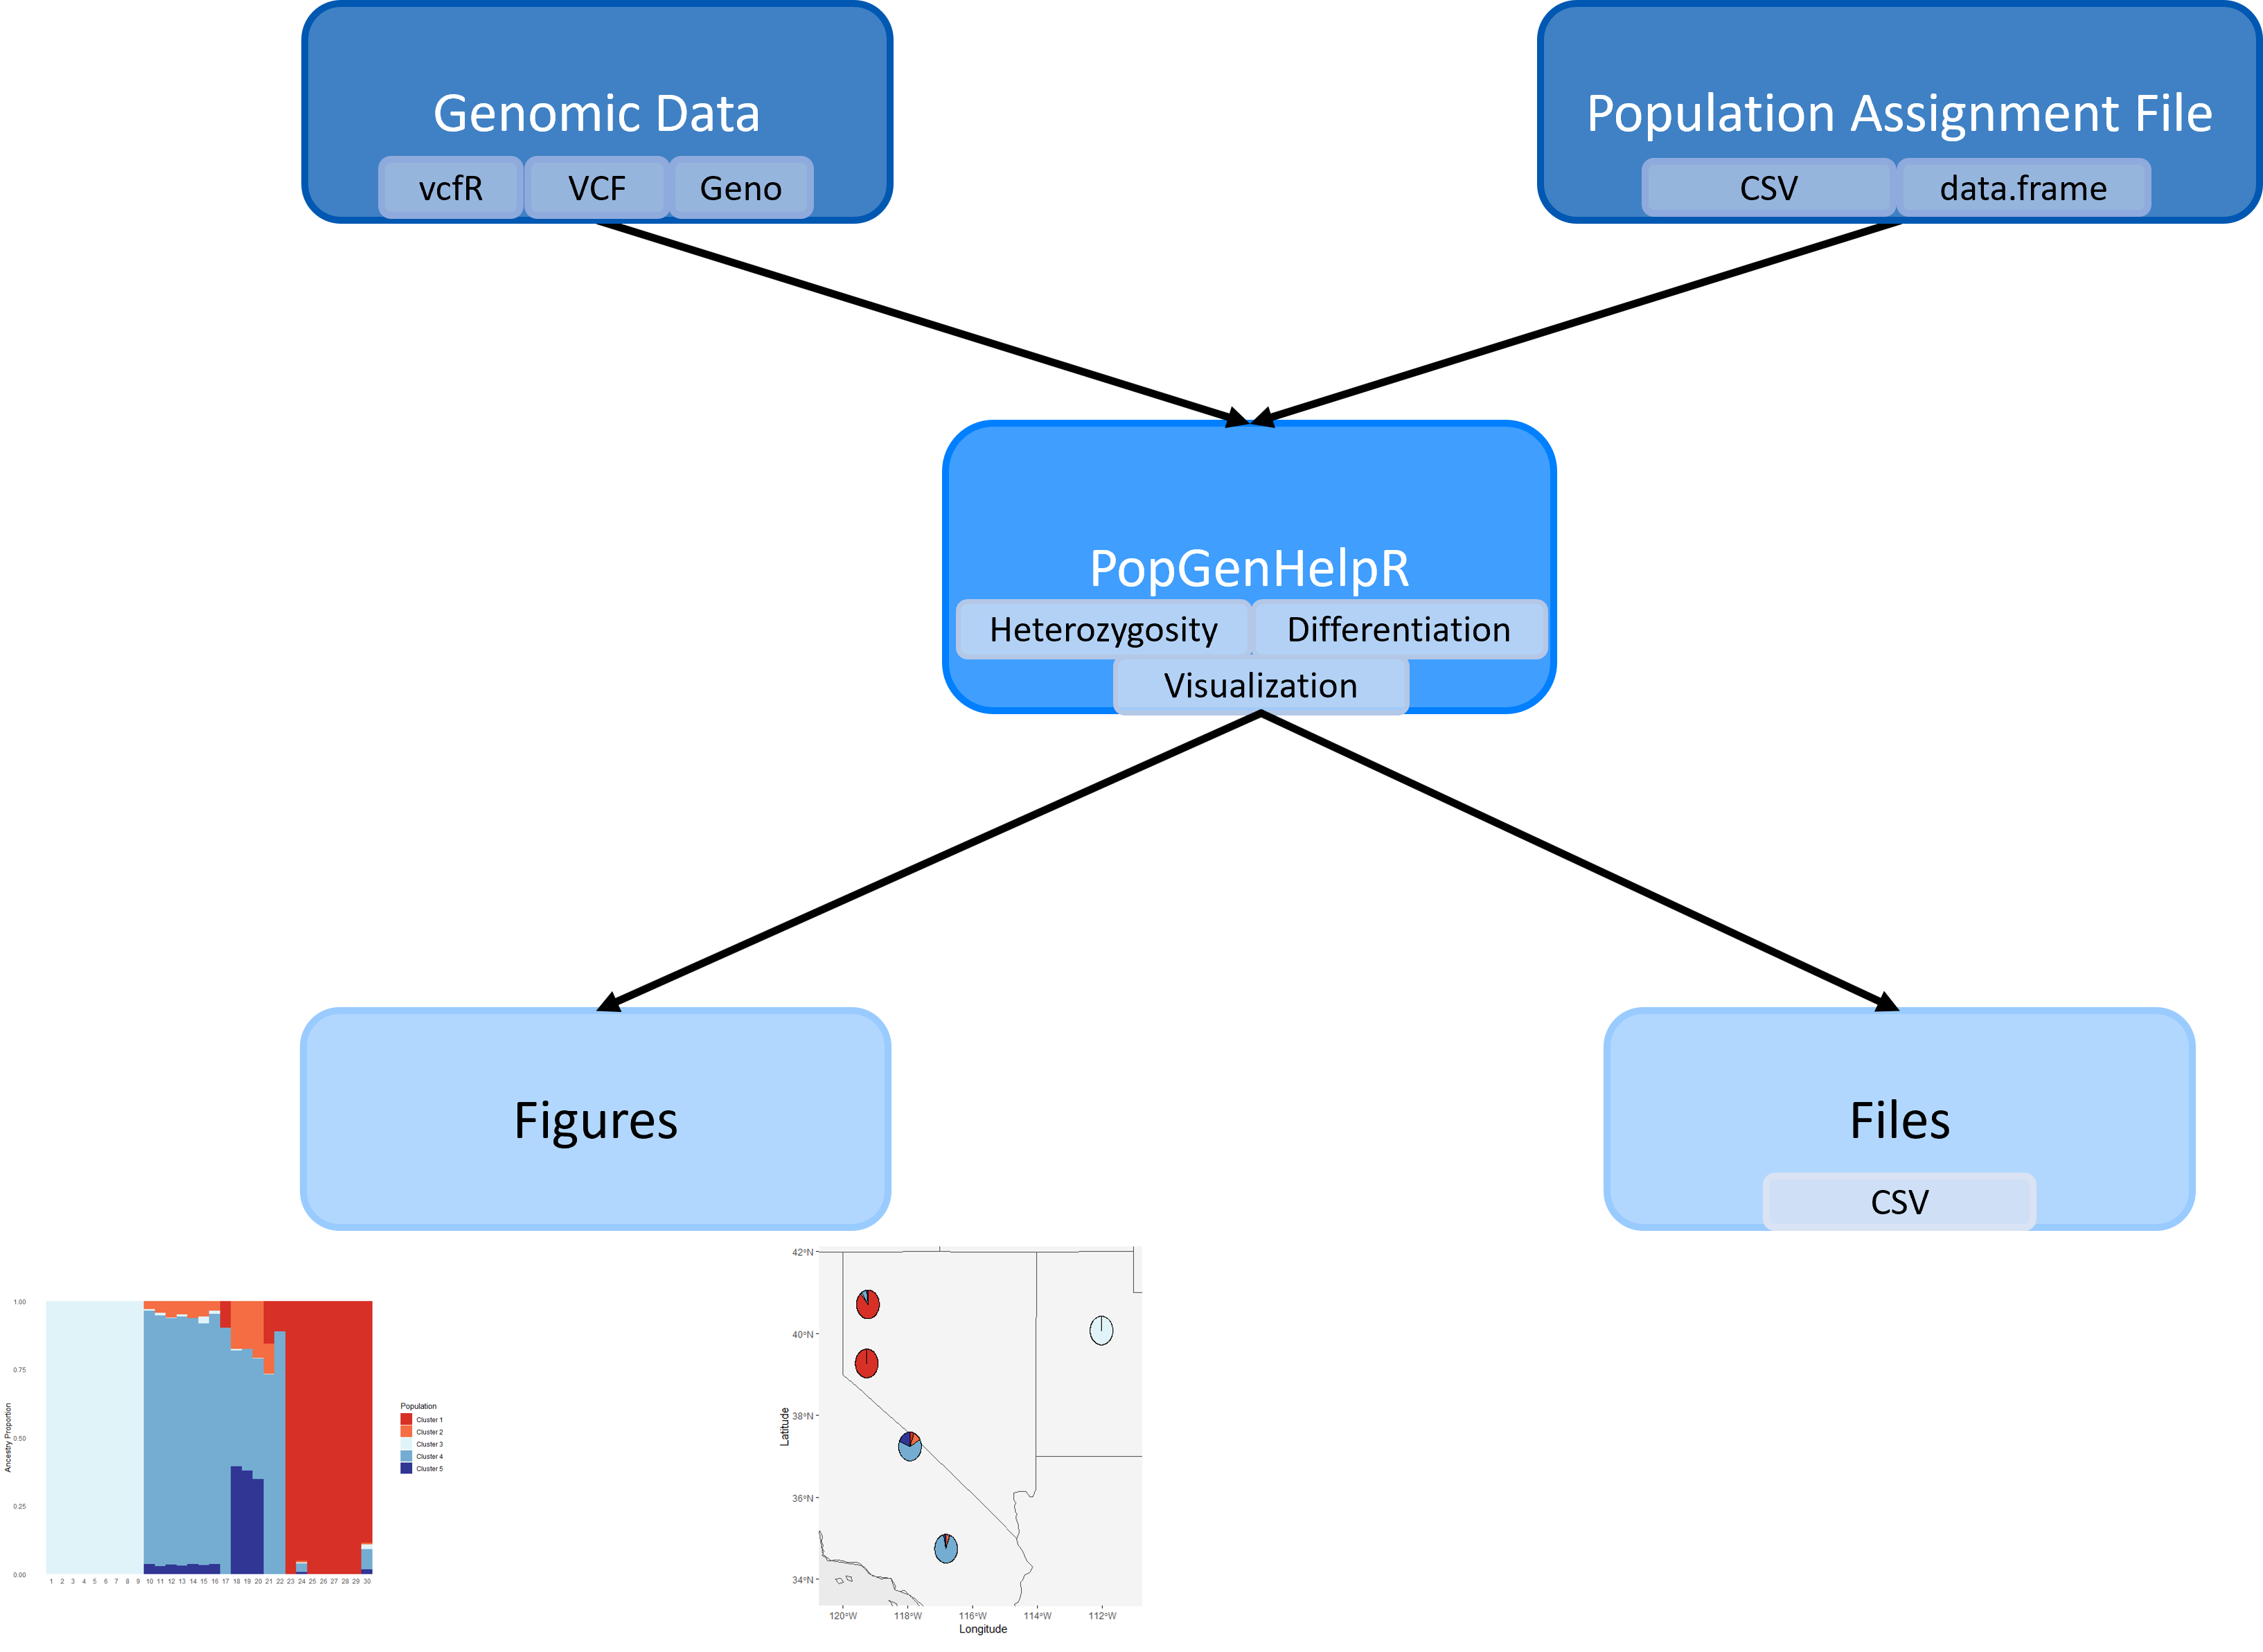 Fig 1. A visualization of the
 PopGenHelpR workflow.
Assumptions of PopGenHelpR
PopGenHelpR is designed to be easy to use, but this also
means that you need to ensure that your data is in order before analysis
and pay attention to any warnings output by the functions.
- Data is assumed to be bi-allelic. Please see the examples on filtering your vcf files to contain biallelic SNPs using vcftools and bcftools, respectively.
# vcftools
vcftools --vcf myfile.vcf --max-alleles 2 --recode --recode-INFO-all --out my_biallelic_file.vcf

# bcftools
bcftools view -m2 -M2 -v snps myfile.vcf > my_biallelic_file.vcf
You can also subset the individuals you wish to include in analysis by filtering the vcf file using commands similar to those we provide below. These commands assume that you have a text file with no headers and one individual per line that you wish to keep.
For example:
example_samples_tokeep.txt
Ind1
Ind2
Ind3
Ind4
Ind5Genomic Analysis
Statistical analysis is a critical component of population genomics
study, but many R packages only calculate a subset of commonly used
population genomic statistics. PopGenHelpR seeks to remedy
this by allowing researchers to calculate widely used diversity and
differentiation measures in a single package.
Heterozygosity
Heterozygosity is a fundamental statistic in population genomics that
allows researchers to evaluate the genetic diversity of individuals and
populations. PopGenHelpR can estimate seven measures of
heterozygosity (individual and population). Here, we will calculate
observed heterozygosity, but please see the documentation for
Heterozygosity to see all of the options. Better yet, check
out our article
on heterozygosity and when to use each measure!
All we need is a vcf or geno file, a population assignment file, and
the statistic you wish to estimate (PopGenHelpR does them
all by default). Note that PopGenHelpR assumes that the
first column indicates sample names and the second column indicates the
population to which each individual is assigned. You can use the
arguments individual_col and population_col to
specify which column indicates the sample and population names,
respectively. You can also write the results to a csv if you set
write = TRUE.
Obs_Het <- Heterozygosity(data = HornedLizard_VCF, pops = HornedLizard_Pop, statistic = "Ho")Differentiaton
Differentiation is another basic analysis in population genomic
studies. PopGenHelpR allows you to estimate
FST, Nei’s D (individual and population),
and Jost’s D. Like Heterozygosity, all we need is
a vcf or geno file, a population assignment file, and the statistic you
want to calculate (PopGenHelpR does them all by default).
Again, individual and population columns are assumed to be the first and
second columns but can be indicated by users with
individual_col and population_col,
respectively.
Fst <- Differentiation(data = HornedLizard_VCF, pops = HornedLizard_Pop, statistic = "Fst")Private alleles
Finally, we will calculate the number of private alleles in each
population. This analysis is often used to evaluate signals of range
expansion and helps researchers identify populations that harbor unique
alleles. Note that Private.alleles can only use a vcf (no
geno files) and does not require you to specify a statistic (all you
absolutely need is a vcf and population file). Otherwise, it operates
just like Heterozygosity or
Differentiation.
PA <- Private.alleles(data = HornedLizard_VCF, pops = HornedLizard_Pop)Let’s move onto visualizations (the fun part), so you can get your work submitted!
Visualizations
A strength of PopGenHelpR is its ability to generate
publication-quality figures. You can generate commonly used figures such
as ancestry plots (bar charts and piechart maps), sample maps, and other
figures such as the Network_map that visualizes
relationships between points on a map.
Ancestry Plots
PopGenHelpR can generate commonly used ancestry
visualizations such as structure-like plots and ancestry piechart maps.
First, we will create structure-like plots for individuals and
populations. We need a q-matrix, population assignments for each
individual, and the number of genetic clusters (K). The q-matrix
represents the contribution of each cluster (K) to an individual or
population and can be obtained from programs like STRUCTURE, ADMIXTURE,
or sNMF. Please see our article
on how to extract the q-matrix from these programs or email Keaka
Farleigh.
# First, we separate the list elements into two separate objects. The q-matrix (Qmat) and the locality information for each individual (Loc).
Qmat <- Q_dat[[1]]
Loc <- Q_dat[[2]]

# Now we will generate both population and individual plots by setting plot.type to 'all'. If you wanted, you could only generate individual or population plots by setting plot.type to "individual" and "population", respectively.
Test_all <- Ancestry_barchart(anc.mat = Qmat, pops = Loc, K = 5,
plot.type = 'all', col = c('#d73027', '#f46d43', '#e0f3f8', '#74add1', '#313695'))

Test_all$`Individual Ancestry Plot`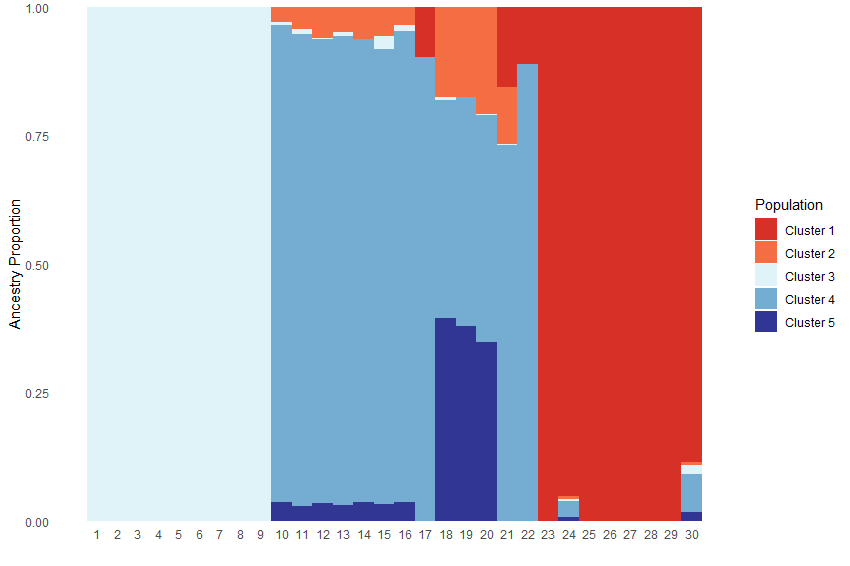
We can also generate an ancestry matrix by population. The ancestry of each population is calculated by averaging the ancestry of the individuals in a particular population.
Test_all$`Population Ancestry Plot`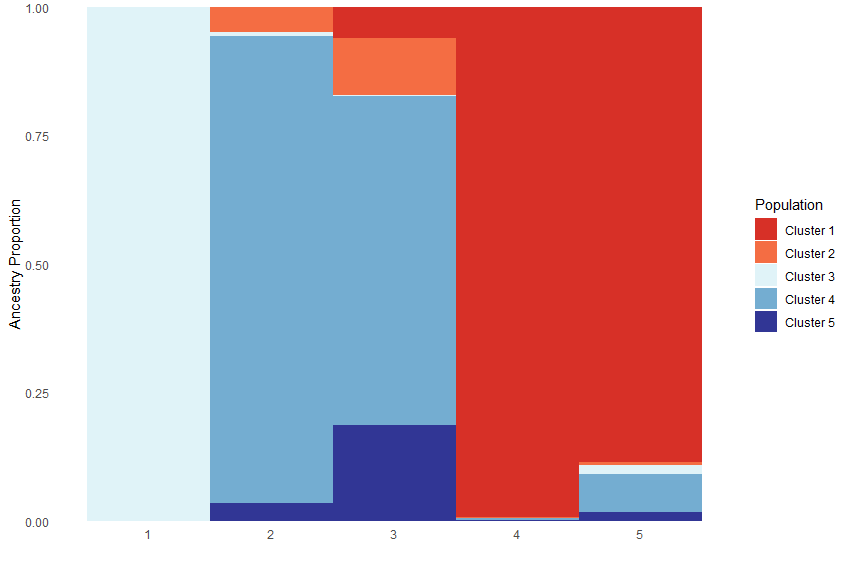
Now, we will generate piechart maps of ancestry using the
Piechart_map function. Piechart_map requires
the same input as Ancestry_barchart with the additional
requirement of coordinates for each individual/population. You’ll notice
that the individual map looks weird; the pie charts have a bunch of
partitions. That’s because we have multiple individuals at the same
location, so the population map is probably a better choice. Instead of
layering individuals on top of each other, the population map averages
the ancestry of individuals in a population before mapping. See our
GitHub for additional examples (https://kfarleigh.github.io/PopGenHelpR/).
# First, we seperate the list elements into two seperate objects. The q-matrix (Qmat) and the locality information for each individual (Loc).
Qmat <- Q_dat[[1]]
Loc <- Q_dat[[2]]

# Now we will generate both population and individual plots by setting plot.type to 'all'. If you wanted, you could only generate individual or population plots by setting plot.type to "individual" and "population", respectively.
Test_all_piemap <- Piechart_map(anc.mat = Qmat, pops = Loc, K = 5,plot.type = 'all', col = c('#d73027', '#f46d43', '#e0f3f8', '#74add1', '#313695'),
                                Lat_buffer = 1, Long_buffer = 1, country_code = c("usa", "mex", "can"))

Test_all_piemap$Individual_piemap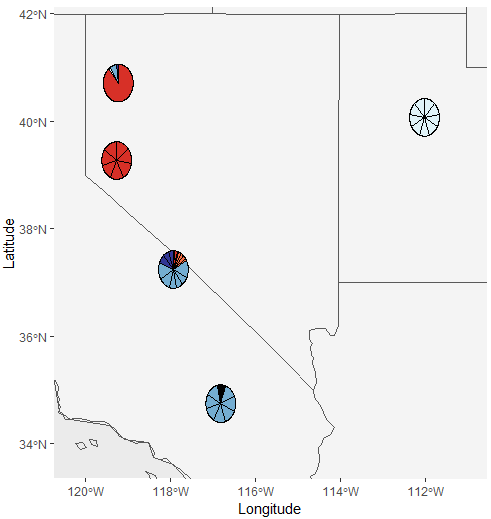
Notice the weird partitions? We can take care of those using the population piechart map.
Test_all_piemap$Population_piemap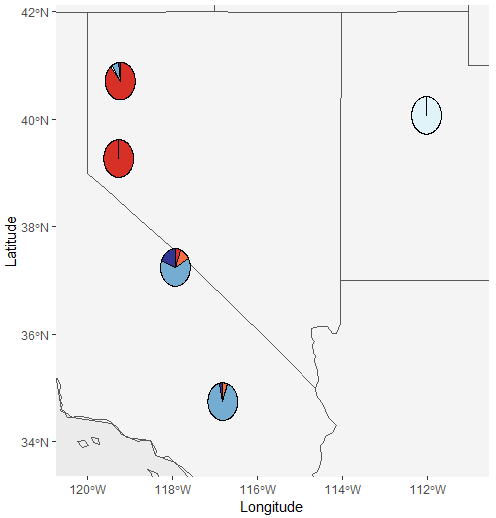
Differentiation visualizations
PopGenHelpR can use symmetric matrices such as those
output by the Differentiation function to plot heatmaps and
network maps. These plots can be great for understanding the
relationships between populations or individuals.
First, we will use the Pairwise_heatmap function, which
allows us to see relationships between populations or individuals and
only requires a symmetric matrix and legend label (statistic argument).
You can also supply a color vector like we do below, but it is not
required.
PW_hmap <- Pairwise_heatmap(Fst_dat[[1]], statistic = "Fst", col = c("#0000FF", "#FF0000"))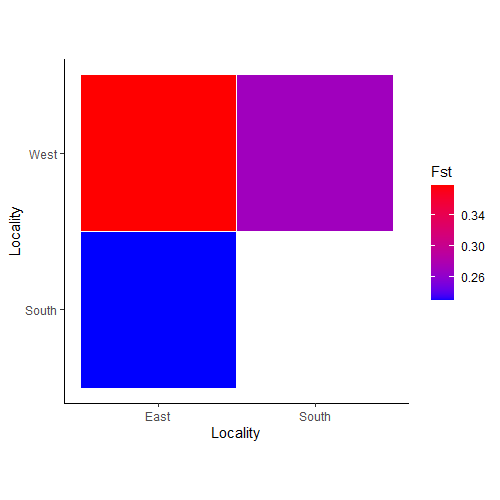
We can also visualize these relationships on a map using the
Network_map function. This function allows us to visualize
pairwise relationships as the color of links between the points. You
must supply a symmetric matrix (dat argument) and population assignment
file (pops argument). The remaining arguments are optional, but they
allow for greater customization. The neighbors argument, for example,
tells the function how many relationships to visualize, and you can also
use it to specify relationships you want to see. Please see the
documentation for details.
NW_map <- Network_map(Fst_dat[[1]], pops = Fst_dat[[2]], neighbors = 2, statistic = "Fst", country_code = c("usa", "mex", "can"))
NW_map$Map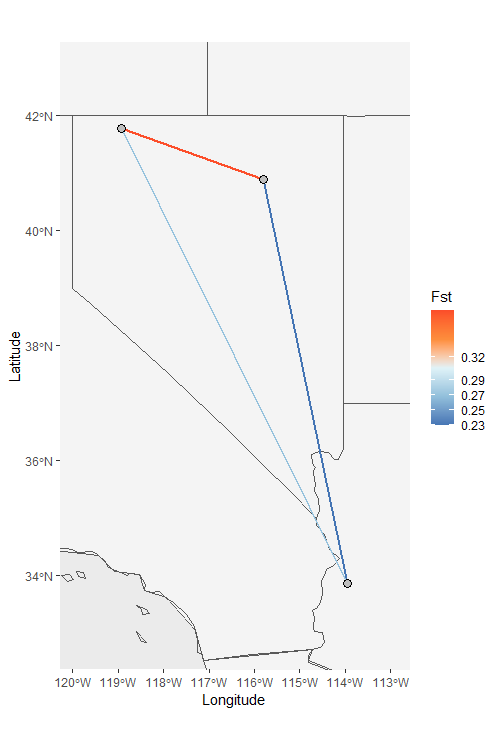
Network_map can also be used to plot specific
relationships. Let’s isolate the populations with the highest and lowest
Fst by supplying a character vector to the neighbors argument.
NW_map2 <- Network_map(Fst_dat[[1]], pops = Fst_dat[[2]], neighbors = c("East_West", "East_South"), statistic = "Fst", country_code = c("usa", "mex", "can"))
NW_map2$Map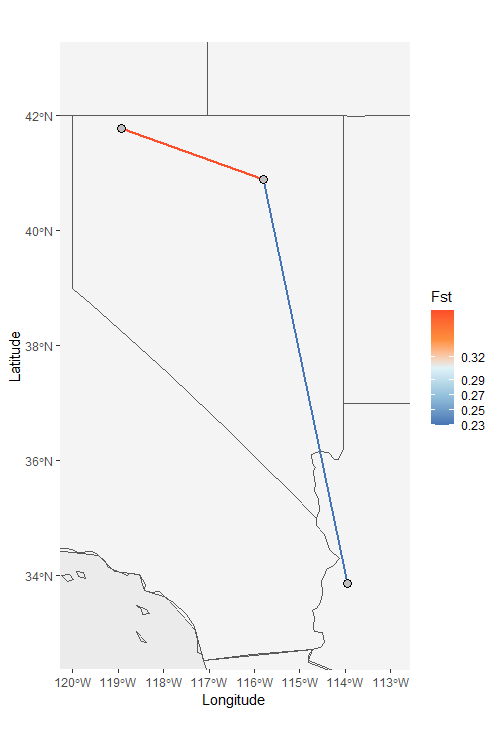
Heterozygosity and Other Visualizations
PopGenHelpR can create maps using output from
Heterozygosity or csv files from external programs to
understand how diversity (or other statistics) is distributed across
geographic space.
We will plot some observed heterozygosity data with the function
Point_map. All you need is a data frame (or csv) and the
name of whatever statistic you are plotting (statistic argument).
Point_map also assumes that the coordinate column names are
Latitude and Longitude.
Het_map <- Point_map(Het_dat, statistic = "Heterozygosity", country_code = c("usa", "mex", "can"))
Het_map$`Heterozygosity Map`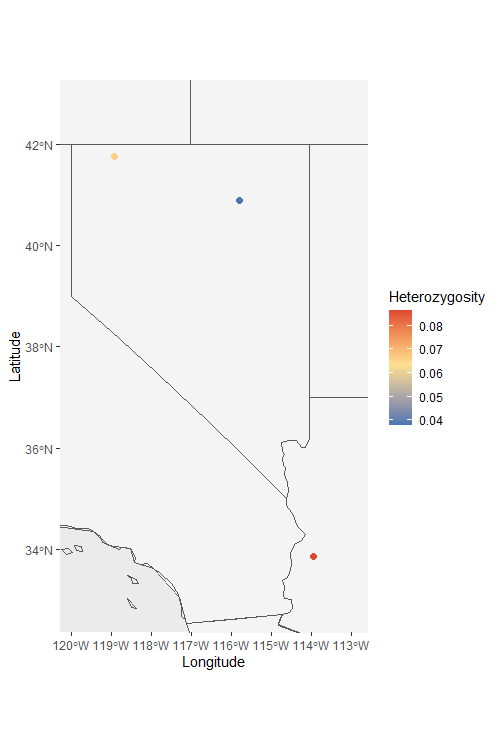
We can also outline the points by setting the out.col
argument.
Het_map2 <- Point_map(Het_dat, statistic = "Heterozygosity", out.col = "#000000", country_code = c("usa", "mex", "can"))
Het_map2$`Heterozygosity Map`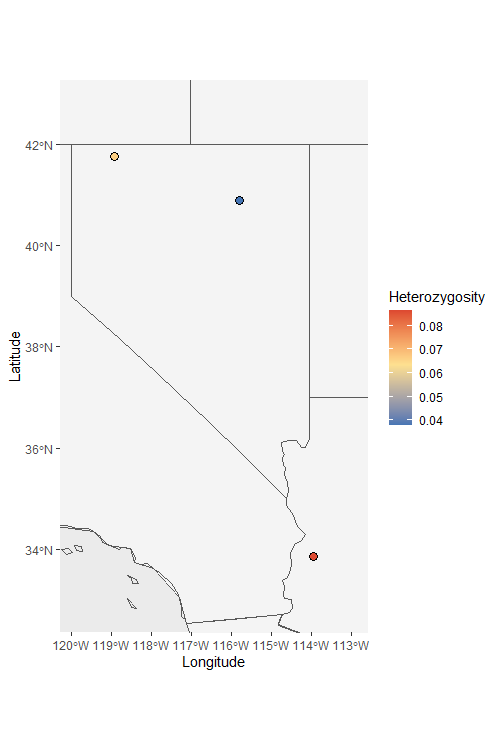
Finally, we can just plot coordinates using
Plot_coordinates. All we need is a data frame or csv file
with the coordinates for each row indicated by columns names Latitude
and Longitude. You can change the size of the points with the
size argument.
Sample_map <- Plot_coordinates(HornedLizard_Pop, country_code = c("usa", "mex", "can"))
Sample_map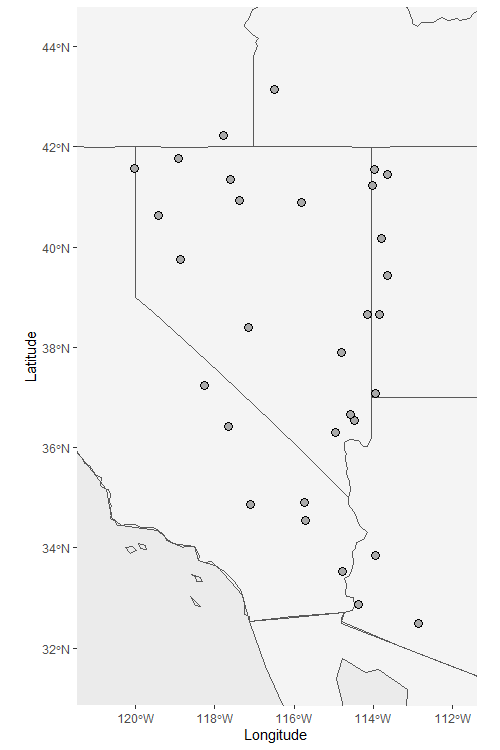
Thank you for your interest in our package; please reach out to Keaka
Farleigh (keakafarleigh@gmail.com) with any questions, things
that should be included in future versions of the package, or if you
would like to be kept up to date with PopGenHelpR.